Photo Credit: Natural History Museum in London, UK
As municipalities consider the carbon impacts of the built environment in their communities, they often select from a panoply of climate action regulations. These ordinances include more stringent energy codes, promoting beneficial electrification, adopting green codes, benchmarking existing buildings and mandating building performance standards for existing and new buildings. Among the menu of options, this article is focused on benchmarking and building performance standards of a sector that is energy intensive and has a very long life - museums.
Museums cover a wide range of building types and purposes. These range from purpose-built structures to house delicate hygroscopic artifacts with tight humidity and temperature requirements to cavernous spaces for airplanes and trains to tiny homes of historical significance. The lighting, heating, cooling and ventilation of these spaces vary greatly. Some museums will also offer amenities such as fast food cafeterias and full service restaurants (which are among some of the most energy intensive building types) which may be open hours after the museum closes. And some facilities rent spaces to events for additional income to support their mission. These are among the many reasons for high energy use in museums. Despite the many variations in the sector, with a comprehensive sustainability plan in hand, museum professionals can predict and manage the operation more effectively while achieving much needed savings.
Enhanced Datasets
The building efficiency metric in the US is Energy Use Intensity (EUI), which is measured by energy use per floor area per year (IP units: kBtu/sqft-yr and SI units: kBtu/m2-yr). A 2017 museum energy use article by IndigoJLD Green + Health shows that many museums have much higher energy use intensity (EUI) values than large skyscrapers in city centers or round-the-clock hospitals. The chart (fig 1) illustrates Site EUI data points expanding from 9 cities in the last study to 22 cities and counties. The current analysis continues to show high energy use prior to closures spurred by COVID-19 safety precautions. The Climate Zones also expanded from three to five. Namely, they are: Cold, Hot Dry, Marine, Mixed Humid, and Hot Humid. It is worthwhile to note that some museums have incorporated large scale renewable energy onsite and managed to dramatically cut down energy use. In the 2017 analysis, the range was from around 50-350 kBtu/sqft-yr in Site EUI. The wider range this time, from close to 0 to over 400 EUI, confirms and reinforces our earlier findings. (fig 1)
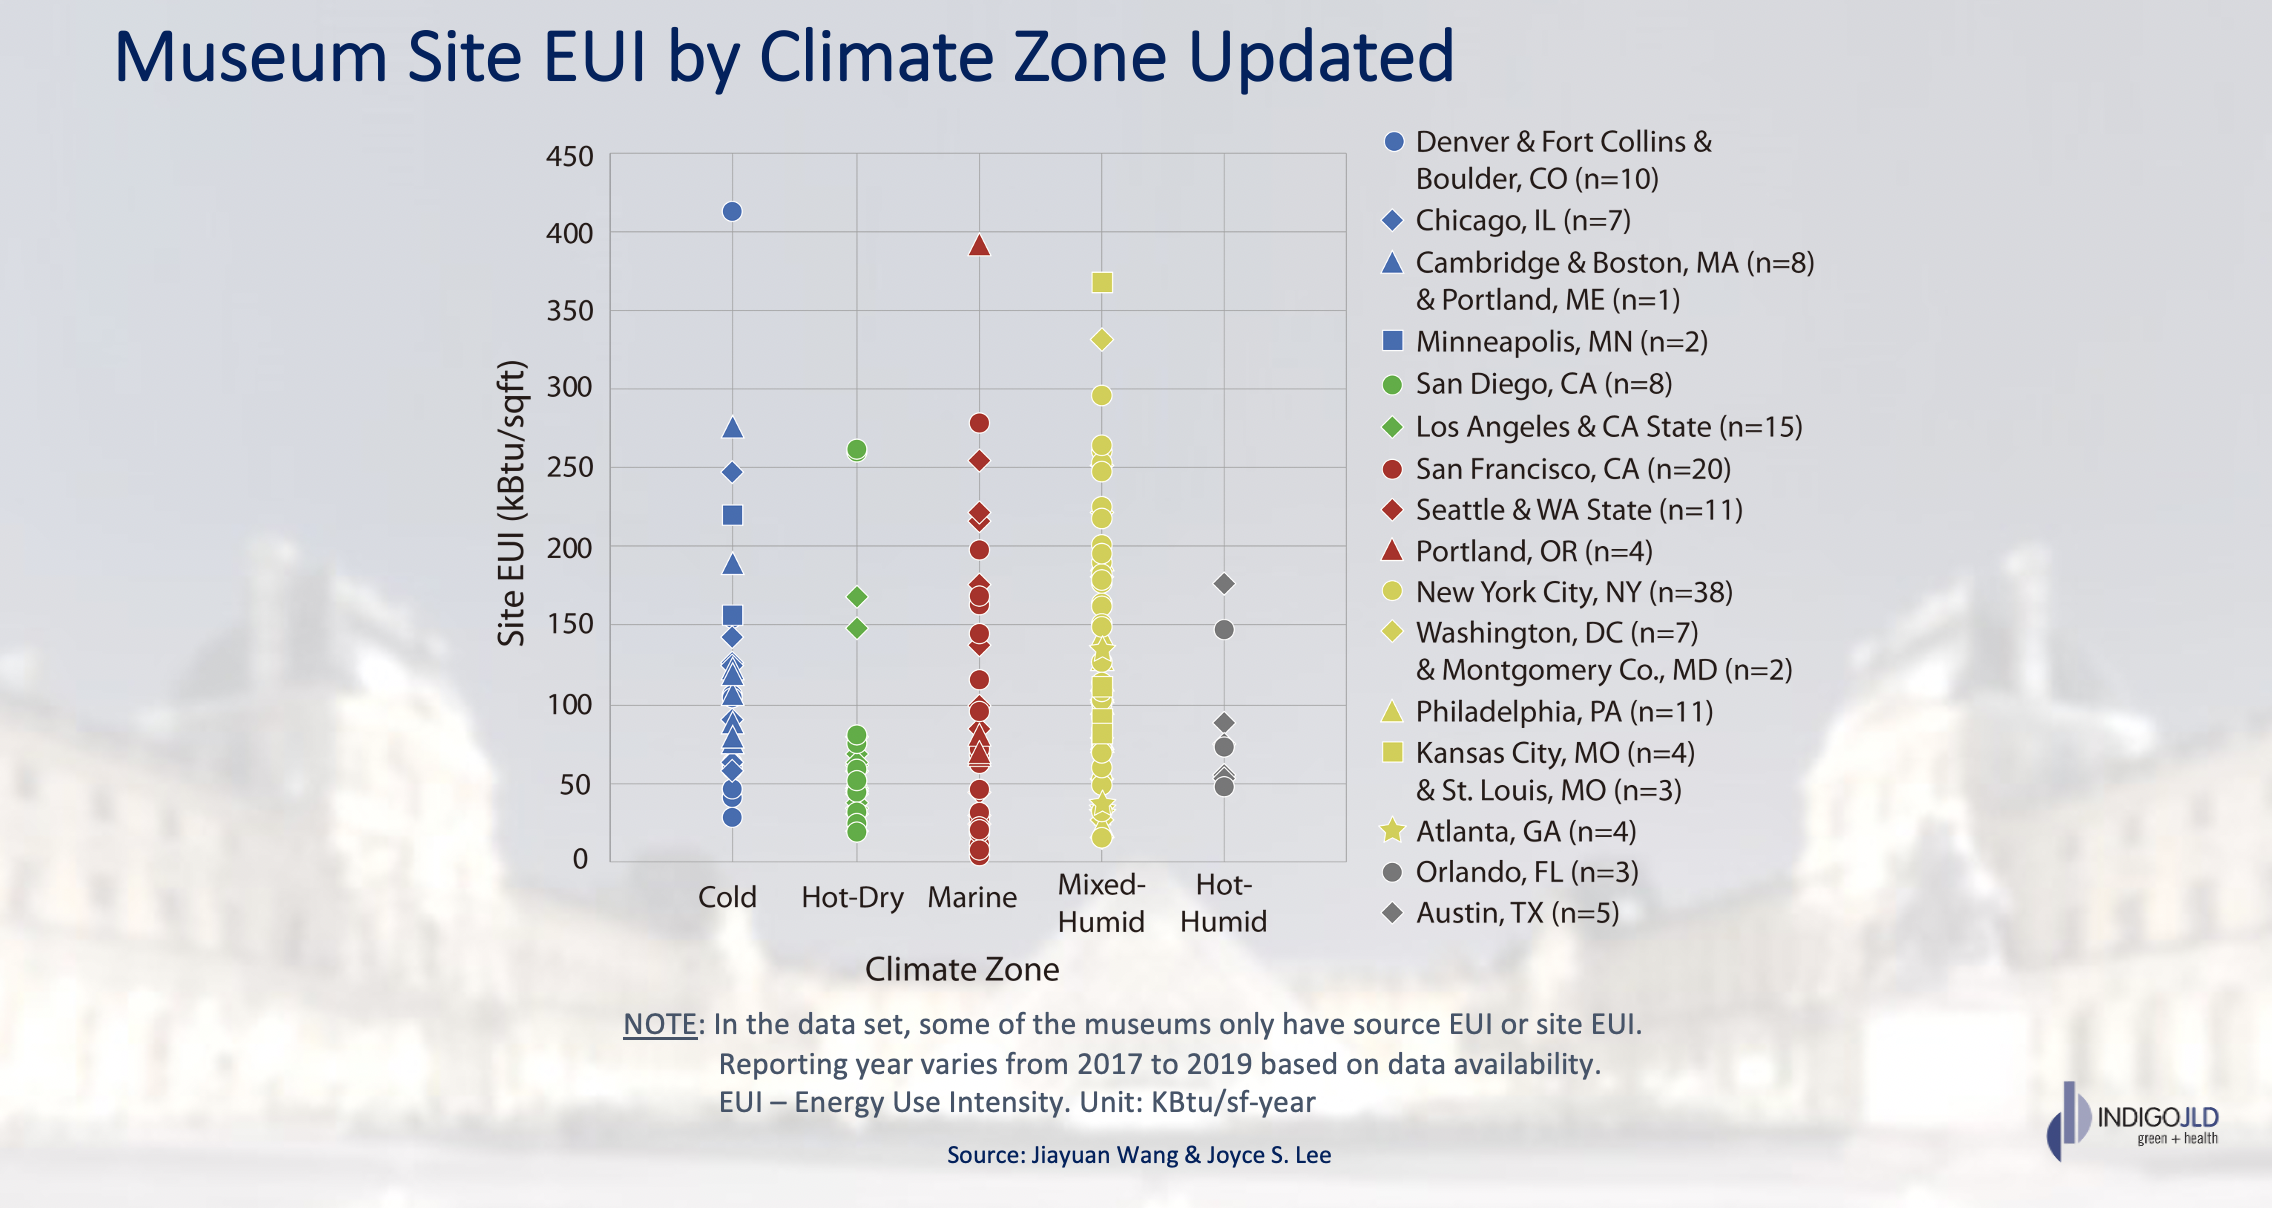
(fig. 1) Museum data from more than twenty cities and counties in five climate zones
With these values we can begin to compare different facilities to each other. It is important to note a number of factors needing further adjustments. First, these values are self-reported. Data fidelity appears to be an issue when outliers appear without apparent reasons. Data entry, missing meters, wrong units-of-measure or incorrect floor area will each skew numbers. Nonetheless, this large range represents both potential inherent waste and significant room for improvement in many museums.
Museums need more Representation
Historically museum owners and staff have had very little guidance to benchmark their energy usage against their peers. Once every four or so years, the US federal government undertakes its Commercial Buildings Energy Consumption Survey (CBECS). CBECS has covered and continues to cover public assembly buildings, but it has commingled museums with other building types including performing art centers and movie theaters. That decision has made understanding energy use in museums difficult as the data available from CBECS cannot be isolated.
CBECS 2018 is already underway at the Energy Information Administration (EIA) of the Department of Energy (DOE). EIA has completed the energy surveys collecting data for all the building types covered in all regions of the US. Data regression analyses are performed before the EIA publishes the new findings. CBECS 2018 publications will likely continue to commingle museums with other public assembly building types. Once EIA publishes CBECS findings (slated for summer 2022), the Environmental Protection Agency (EPA)’s ENERGY STAR will begin processing the data to update their ENERGY STAR Scores for eligible property types (slated for 2023). Museums are not currently included in ENERGY STAR. Groups led by the American Alliance of Museums Environment and Climate Network have started to address the lack of detailed information and gaps in data. Absent sufficient CBECS data, EPA looks to industry associations to administer a survey that could provide the data needed for score development.
Another CBECS user is the American Society of Heating Refrigerating and Air-Conditioning Engineers’ (ASHRAE) Building Energy Quotient or Building EQ. Without CBECS data specific to museums, ASHRAE’s building energy use rating system is similarly held back by a lack of data as ENERGY STAR is. Another addition is ASHRAE’s Standard 100-2018 and future updates to the standard. ASHRAE Standard 100 starts with CBECS median EUIs for 52 building types in all US Climate Zones. Museums are again not represented but instead will need to self-select into a handful of Public Assembly categories such as: entertainment/culture, library, recreation, social/meeting or other public assembly. Because these building types’ target EUIs are in the same range, all are quite low and do not reflect the lighting and HVAC demands of museums. The lack of a distinct museum building type could hinder the effort of museum professionals and their local governments to achieve collective carbon goals.
“Museums perform critical services for the public and often consume significant energy. Many museums are seeking to save energy, cut costs, and protect the environment. Additional energy data to benchmark themselves against, and ideally a 1-100 ENERGY STAR score would greatly aid them in this important work,” said Cliff Majersik, Senior Advisor, at the Institute for Market Transformation, a nonprofit dedicated to advancing high performance buildings.
Regional Movement
When cities and states enact legislation placing a cap on EUI for existing buildings they sometimes reference ASHRAE Standard 100 or ENERGY STAR for their benchmarking. The lack of museums in CBECS or ENERGY STAR mean that the buildings will either need exemptions from such regulation or the authorities will have to make their own dataset and target EUIs. Washington State’s building performance standard (BPS) (RCW 19.27A.200 - 19.27A.220) has created such targets: 70 EUI for Climate Zone 5B and 67 EUI for Climate Zone 4C for museums, but it is worth noting that they reuse these EUIs for seven other public assembly types as well – Indoor Arena, Movie Theater, Performing Arts, Racetrack, Stadium (Open and Closed), Other. The lack of unique data for museums is pervasive.
New York City’s Local Law 97 has carbon emissions caps for building types and not energy use caps. But these caps are based on building code classifications which don’t always treat museums fairly. They are either business (B) or institutional (I) in the classifications. These types of laws are relatively new and how museums will fare is a work in progress.
Also building on CBECS datasets is the Architecture 2030 efforts and the American Institute of Architects’ (AIA) 2030 Challenge efforts to help designers reduce their design projects’ future energy use by targeting ever-reducing EUI values towards net zero in 2030. Architecture 2030 has an online tool called the Zero Tool which helps users determine their project’s target EUI. The Zero Tool was built around ENERGY STAR using CBECS 2003 data. Museums are in the Zero Tool, but the baseline EUI are significantly lower than museums’ actual performance data. An example is a museum baseline in Denver showing 38 EUI (fig. 2).

(fig. 2) Sample output from the Zero Tool
Looking Ahead
As the large gap exists between current consumption levels and stated median targets associated with CBECS, museums seem unnecessarily penalized for their performance. A 50% reduction from 67 EUI is drastically different, and with vastly different cost implications, than a 50% reduction from say 150 EUI by 2030.
When there is little data help, cities are left with few tools to regulate or even foster innovation in museums. This void can create confusions among designers, operators and owners, thereby making it harder for them to tackle carbon issues effectively. And the lack of near-term programs to fill these voids will only perpetuate ambiguities in the long term.
A note of optimism - while there is data noise and a lack of clarity in the baseline/targets, there are already cultural leaders, such as the Australian Museum in Sydney, that received carbon neutral certification in 2021. In the US, the museums approaching 0 EUI include the Exploratorium in San Francisco and the Phipps Conservatory in Pittsburgh. Developing a solid plan to go carbon neutral can send a strong signal during this year of COP 26 honoring the Paris Agreement. The Natural History Museum in London, UK, has done just that by committing to go net zero by 2035.

Photo Credit: The Australian Museum in Sydney
Another note of optimism – cultural institutions possess enormous in-house talent and can access plenty of helpful tools, such as ARC and ENERGY STAR Portfolio Manager. With the support of museum leadership, trustees and local governments, many museums can craft pathways of success similar to the examples above.
Authors:
Joyce Lee, FAIA, WELL AP, LEED Fellow, is president of IndigoJLD providing green health, planning and design services on exemplary projects. Joyce served in New York City OMB as Chief Architect in the Bloomberg Administration. Her practice continues to assist cities, communities and cultural buildings to strengthen sustainability and wellness goals.
Jamy Bacchus, PE, LEED AP, BEMP, is a senior associate at ME Engineers, where he works on sustainability in the built environment including beneficial electrification, net zero design, codes & standards and carbon accounting. He is a member of the LEED Energy & Atmosphere Technical Advisory Group (EA TAG).